

This week, we’ll cover a new malware specimen called Sysjoker and a guide for Linux memory forensics. Although the forensics guide isn’t comprehensive and certainly not in full detail, it might help in understanding the basics of a memory extraction and analysis process using Volatility.
Sysjoker Backdoor
In a recent post by Intezer, the authors analyzed a new backdoor capable of running on multiple operating systems. According to the analysis, “Sysjoker” can run on macOS, Linux, and Windows. Sysjoker hides as a system update and uses different methods to hide and change its Command and Control (C2) server’s IP address.
It’s also concerning that the sample came clean from VirusTotal scans, which may indicate that the backdoor is fairly new. Although the methods it uses to infect a system are different on various operating systems, once it gains persistence on a system, it begins communicating with the C2 server. In the analysis, Intezer states that they haven’t seen a next stage instruction from the C2 server yet. The post suggests using memory scanners to detect the malware.
Another way of doing forensic analysis is to dump the memory and analyze it with a well-known tool like Volatility. In the older versions of the Linux kernel, dumping the memory could be achieved by copying the virtual memory from /dev/mem using a command-line tool like dd; however, this method was deprecated because of potential security implications.
Linux Memory Forensics
We can sum up forensic analysis as the different methods used in evidence acquisition, analysis of evidence, and documentation of the consequences of a security incident. After a confirmed security breach, a forensic analysis usually takes place to understand better what went on in a compromised system. There are numerous sources of evidence that you can analyze to make defensible claims about the source of an incident; however, we’ll only do a hands-on memory analysis of a compromised Linux system to demonstrate some of the methodologies and tools you can use.
Memory
RAM, by nature, is volatile. It requires constant power to go through it to function, and it gets reset every time a system reboots. Linux keeps the data stored in memory under the /dev/mem directory; however, it’s impossible to extract artifacts from memory using this partition directly in more recent distributions. This is because starting in Linux kernel 4.16, an option (CONFIG_STRICT_DEVMEM) gets enabled by default to disallow access to this sensitive partition.
Although this makes it harder to acquire the memory image, it also makes it more difficult for adversaries (and inexperienced users) to cause devastating damage to the system. An attacker with root access to the system may use the mem device to inject code directly into the kernel if this option is disabled.
We’ve spun up a Debian 9 Linode with the hostname “forensics” in one of our data centers for this demonstration. We configured the forensics box to be an example of a building and analysis environment. Although it’s not necessary to do these on an external machine, tampering with a computer that holds evidence is inadvisable. Here are the steps to our analysis:
- Create a Volatility profile for a compromised system using a machine with the same OS and kernel build/version.
- Dump the memory with your tool of choice (AVML in this demo).
- Inspect the dumped memory using the profile you’ve created for Volatility with the help of plugins.
Warning
We will use the Python 2 repository of Volatility for demonstration purposes because of the compatibility issues currently in progress with Volatility 3. We are aware that support for Python 2 ended in 2020; this is strictly to demonstrate the use of the tool in a controlled environment. If you’d like to follow along with the guide, please do so at your own risk.
Requirements
By default, Debian 9 Linodes will lack some of the tools we’re going to use in this demo. It’s recommended to install all of them with the following command before proceeding with other instructions:
sudo apt install make git zip dwarfdump linux-headers-$(uname -r) python-pip python-distorm3 python-cryptoVolatility
The Volatility Framework is a completely open collection of tools implemented in Python under the GNU General Public License to extract digital artifacts from volatile memory (RAM) samples.
It’s important to ensure that the correct Volatility profile gets used when analyzing a memory dump. A profile is a file containing information about a kernel’s data structure and debug symbols that can be used to parse a memory image properly. Luckily creating a profile with Volatility is quite simple. You can also check out the repository of Volatility profiles for some pre-built profiles.
Building A Profile
After installing the necessary tools, we can begin building our Volatility profile for the machine it’s running on.
1. git clone https://github.com/volatilityfoundation/volatility ~/volatility
2. cd ~/volatility/tools/linux/
3. make
4. zip ~/$(lsb_release -i -s)_$(uname -r).zip ./module.dwarf /boot/System.map-$(uname -r)
5. cp ~/$(lsb_release -i -s)_$(uname -r).zip ~/volatility/volatility/plugins/overlays/linux/
6. python ~/volatility/vol.py --info
The initial line (1) will clone the Volatility repository into the user’s home directory. By going into the (2) ~/volatility/tools/linux directory, we can use make (3) to recompile the modules of the kernel. It’s important to have the kernel headers downloaded beforehand, otherwise this process might fail.
This results in a module.dwarf. Then the next command (4) uses this module to read the system map from /boot to generate the profile we need to use in Volatility. We can then copy this profile (5) over to the right directory, so that Volatility can use it. Finally, to verify our profile is properly loaded into Volatility we can run Volatility once with the info flag (6). If all the steps are successful, we should see our custom profile in the Profiles section of the output.
Installing a Hidden Kernel Module
For this example we’ve used HiddenWall to generate a hidden Linux Kernel Module (LKM), named it ‘cantfindme’, and loaded it onto another Debian 9 Linode with the same kernel build/version as the ‘forensics’ machine. Although the module is loaded, it can’t be seen when lsmod or modprobe is executed on the system:

Memory Acquisition
There are great tools that you can use to dump the memory in Linux; however, in this guide, we’ll go with AVML (Acquire Volatile Memory for Linux) since LiME is covered frequently on the web. AVML is an open-source memory acquisition tool for Linux made by Microsoft. You can find the latest release here and download the binary to the machine from which you want to dump the memory. Remember that the computer we’re dumping the memory from must have the same kernel/OS build and version as the Volatility profile we have generated previously.
In a real-life scenario, it’s important not to tamper with a compromised system to ensure the evidence we collect may be admissible in a court of law. It’s also important not to compress any images whenever possible because bit-by-bit acquisition may provide data that a compressed image may not.
After downloading the AVML binary onto the home directory, you can use the following command to dump a system’s memory to the home directory.
sudo ~/avml ~/output.limeAVML will dump the memory in LiME format, so that we can begin our analysis with the Volatility profile we’ve created. You can also check out the size of the dump to ensure it matches the total RAM on the device. Volatility shouldn’t tamper with the memory dump, but it’s better to make a copy of the file and to analyze the copied data instead of the original after ensuring that their hashes match.
After dumping the memory of the ‘pwnd’ box, we’ve transferred it to the ‘forensics’ box for analysis.
Volatility Plugins
Volatility offers numerous plugins to aid the forensic analyst. You can find a list of these plugins in their Github page. By using Volatility plugins we can get a quick overview of the memory image. The command format for analyzing a memory image can be found below:
python ~/volatility/vol.py -f <path_to_memory_dump> --profile=<profile>
<plugin_name> <plugin_options>
Here’s the output from the plugin linux_hidden_modules that lists the hidden loaded kernel modules from the memory image:

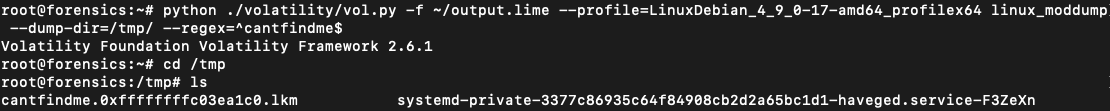
This plugin can help you find hidden Linux Kernel Modules that may be malicious. Even when these modules can’t be seen when you run lsmod on the system, they can both be detected and extracted from a memory dump. You can use the linux_moddump plugin to dump the kernel modules either by specifying their name in a regex pattern or by specifying the base address of the module in the memory image:
There is more that can be done with Volatility that we simply can’t cover in this post. Feel free to leave a comment down below to share your thoughts and suggestions.


Comments